I recently heard Harper Reed speak at Think Chicago. I thought his quantifed self idea was awesome so I made my own.
Tom Quantified (Yesterday)
- Amount of Sleep: 8 hours, 16 minutes
- Amount walked: 5.2 miles
- Time Spent on Spotify: 2 hours, 39 minutes
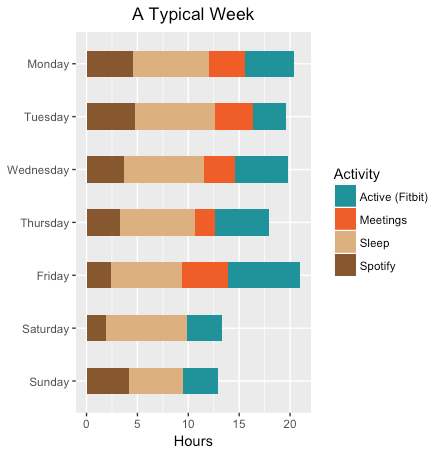
A Day in the Life
I was curious how I spent my days. Using the Fitbit API, Spotify API, and work schedule I quantitatively broke it down. Below is a graph I created in R using ggplot2.
My Google Analytics for this Site
I created an R shiny application for my Uber job interview. Pardon the aesthetics